
Home page/Dashboard
Each BRS user has a Dashboard (Home page) the area under the site list button can be personalised by adding KPI graphs (Widgets).Widgets
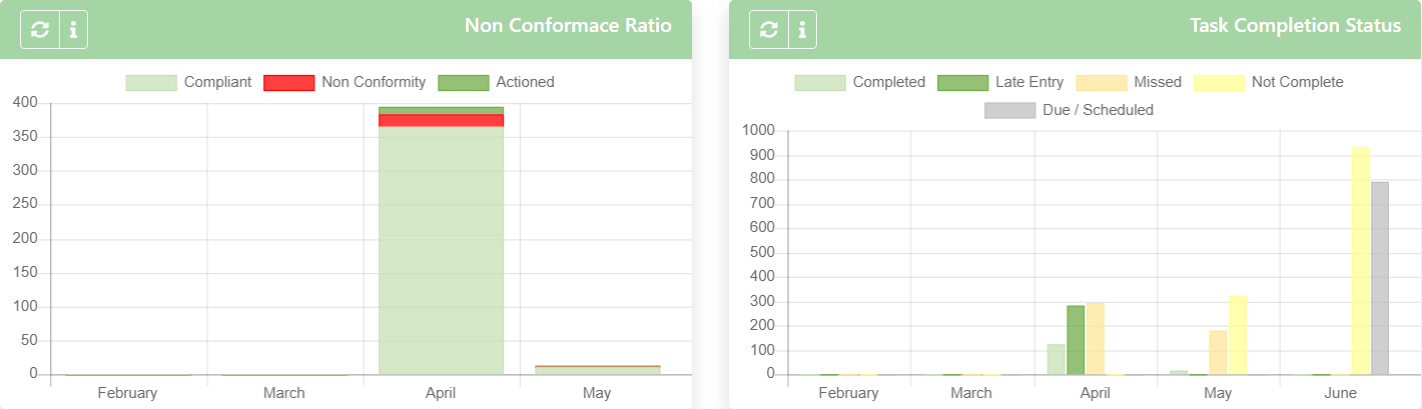
L8MS are adding Widgets designed to allow each user to customise summary information graphs that give a quick visual representation of for example 'Task completion status' or 'non-conformity ratios'.
- Select the User settings option from the left menu or click the customise button (upper right) to display a list of current Widgets.
- Click the Add button (upper right) to add a new Widget.
- Select the required Widget from the drop down list.
- Select the Group Name drop down to restrict the results to a particular site group.
- Select the Site Name drop down to restrict the results to a particular site (if required).
- Select the Responsibility Name drop down to restrict the results to a particular task responsibility group (if required).
- Add an Order Number to control the position order of the graph on the dashboard.
- Add a Descriptive Name to identify the graph and it's limitations on the dashboard (e.g. "All Demo school sites - non-conformity ratio.